The Midnight Call That Cost $2.3 Million
When the CTO of a mid-market SaaS company received the call. Their payment processing system had crashed during peak usage hours in the European market. By the time engineers assembled, identified the issue, and deployed a fix, 6 hours of prime business operations were lost. The immediate cost? $180,000 in lost transactions. The hidden cost? $2.1 million in customer churn over the following quarter.
This scenario plays out across enterprises daily, yet most organizations continue operating in perpetual reactive mode, treating symptoms rather than preventing diseases in their software infrastructure.
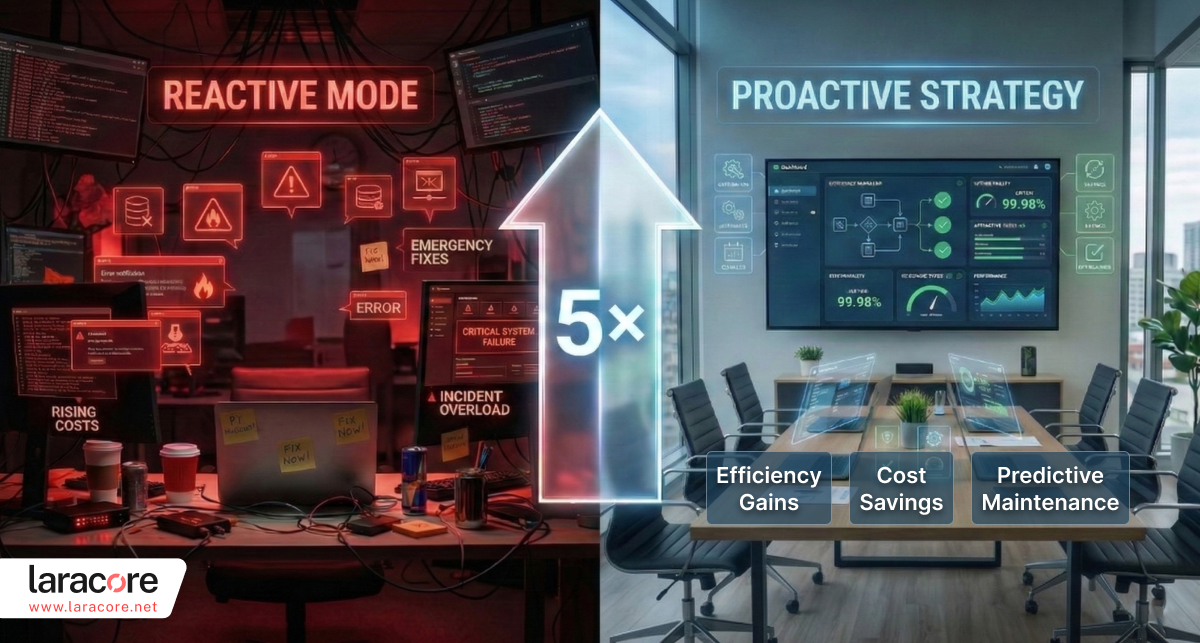
The Real Economics: Breaking Down the 5x Multiplier
Direct Costs of Reactive Maintenance:
When your team operates in firefighting mode, the immediate expenses are obvious—overtime pay, emergency vendor support, expedited cloud resources. But these represent merely 20% of the actual cost burden.
Research from the Software Engineering Institute reveals that fixing a bug in production costs 5-10 times more than catching it during development, and 15-20 times more than preventing it through proactive architecture reviews. For enterprise systems processing millions in daily revenue, this multiplier becomes devastating.
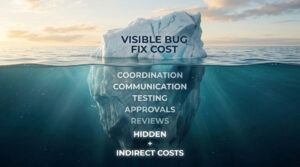
Consider a critical bug that takes 40 engineering hours to resolve in production. At $150/hour blended rate, that’s $6,000 in direct labor. But the complete cost picture includes:
- Incident response coordination: $2,400
- Stakeholder communication and damage control: $3,000
- Root cause analysis and documentation: $4,500
- Regression testing across affected systems: $8,000
- Emergency change approval processes: $1,800
- Post-incident review and process updates: $2,200
Total actual cost: $27,900—4.65x the visible labor cost.
The Downtime Domino Effect
System downtime doesn’t exist in isolation. When your platform goes dark, the consequences cascade across multiple business dimensions simultaneously.
Revenue Hemorrhage: For e-commerce platforms, every minute of downtime translates to lost transactions. Industry benchmarks suggest that enterprise applications averaging $10M in annual revenue lose approximately $7,000 per hour of downtime. But this calculation ignores the acceleration factor—downtime during peak periods (holiday seasons, product launches, fiscal quarter-ends) can 10x this baseline.
SLA Penalties and Customer Confidence: Enterprise contracts typically include service level agreements with financial penalties for non-compliance. More critically, repeated incidents erode customer confidence. Gartner research indicates that 25% of enterprise customers begin evaluating alternatives after experiencing three significant outages within a 12-month period.
Employee Morale and Retention: Engineers don’t join companies to spend weekends fighting fires. Constant reactive work creates burnout, with studies showing that engineering teams operating primarily in reactive mode experience 40% higher attrition rates. Replacing a senior engineer costs $150,000-$300,000 in recruitment, onboarding, and lost productivity.

The Risky Update Paradox
Organizations trapped in reactive cycles face a cruel paradox: they’re too busy fixing issues to implement updates properly, yet delayed updates create more issues requiring immediate fixes.
Security patches sit in backlog for months because “there’s no time to test properly.” Performance optimizations get deprioritized because “we need to focus on keeping things running.” Dependency updates accumulate until the gap becomes so large that upgrading becomes a high-risk, multi-month project itself.
This creates compounding technical debt. Every delayed update increases the complexity of the eventual upgrade. Every workaround implemented to “just keep things running” adds another integration point that must be maintained.
The Ownership Vacuum
Perhaps the most insidious aspect of reactive firefighting is the erosion of ownership. When everything is urgent, nothing is owned. Teams operate in survival mode, making quick fixes without understanding broader system implications.
This manifests in several destructive patterns:
Knowledge Silos: Critical system knowledge exists only in the heads of individuals. When they’re unavailable, incidents escalate unnecessarily. When they leave, institutional knowledge evaporates.
Cargo Cult Fixes: Teams implement solutions that worked before without understanding why, leading to configuration drift and mysterious system behaviors.
Architecture Entropy: Without ownership and planning, system architecture degrades into a patchwork of quick fixes, making future changes progressively more difficult and risky.
The Proactive Alternative: Prevention Economics
Organizations that shift from reactive to proactive maintenance report transformational economics:
Cost Reduction: Automated monitoring and preventive maintenance reduce incident frequency by 60-80%. For an organization experiencing 24 production incidents annually at $28,000 each, this represents $403,200-$537,600 in annual savings.
Predictable Capacity Planning: Instead of emergency resource allocation, teams can plan capacity based on roadmap priorities. This improves resource utilization by 35-40%, effectively increasing engineering capacity without adding headcount.
Release Velocity: With stable systems and clear ownership, release frequency increases 3-5x while defect rates decrease 40-60%. This accelerates time-to-market for new features, directly impacting competitive positioning.
Talent Retention: Engineering teams working on planned improvements and innovation retain talent at significantly higher rates. The organizational knowledge preservation alone saves hundreds of thousands in replacement costs.
Implementing Proactive Maintenance: The First 90 Days
Phase 1 (Days 1-30): Visibility and Measurement
Establish baseline metrics for:
- Mean time to detect (MTTD)
- Mean time to resolve (MTTR)
- Incident frequency by severity
- Percentage of engineering time spent on unplanned work
- Technical debt accumulation rate
Deploy comprehensive monitoring covering application performance, infrastructure health, dependency status, and business metrics. The goal is eliminating blind spots where issues can hide.
Phase 2 (Days 31-60): Ownership and Accountability
Define clear ownership for every system component. Create a RACI matrix (Responsible, Accountable, Consulted, Informed) for each service.
Implement Service Level Objectives (SLOs) with error budgets. This creates permission to invest in reliability rather than treating every minute of downtime as a crisis.
Establish scheduled maintenance windows and change management processes. Risky updates should never be surprises.
Phase 3 (Days 61-90): Automation and Prevention
Build automated health checks that detect anomalies before they become incidents. Implement progressive deployment strategies (canary releases, blue-green deployments) that minimize blast radius.
Create runbooks for common scenarios, reducing mean time to resolution through standardized responses. Establish post-incident learning processes that prevent recurrence rather than assigning blame.
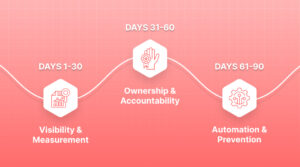
Image 4 – 90-Day Transformation Roadmap: Timeline visualization showing three phases:
- Days 1-30: Visibility & Measurement (icons: dashboard, magnifying glass, charts)
- Days 31-60: Ownership & Accountability (icons: shield, handshake, checklist)
- Days 61-90: Automation & Prevention (icons: robot, lock, rocket) Include key deliverables for each phase Style: Horizontal timeline with milestones, professional color progression
The Strategic Imperative
The choice between reactive firefighting and proactive maintenance isn’t operational—it’s strategic. Organizations that remain perpetually reactive lose the ability to innovate, allowing competitors to capture market share while they’re distracted by internal chaos.
The math is unambiguous: investing $1 in proactive maintenance saves $5 in reactive costs while simultaneously increasing delivery velocity and team satisfaction. For enterprise engineering organizations, this translates to millions in annual value creation.
The question isn’t whether you can afford to implement proactive maintenance. It’s whether you can afford not to.
Conclusion: The ROI You Can’t Ignore
Every hour spent firefighting is an hour not spent on innovation. Every emergency fix is a missed opportunity to strengthen your architecture. Every talented engineer who leaves due to burnout is institutional knowledge lost forever.
The transition from reactive to proactive isn’t instantaneous, but the ROI compounds quickly. Organizations that commit to this transformation report measurable improvements within 90 days and transformational results within 12 months.
The midnight calls will keep coming until you address the root causes.
The question is:
How much more will you pay before investing in prevention?

Faheem Hasan
Brings over 12+ years of specialized experience in web and Laravel application development, backed by a proven 99.9% reliability record across enterprise-grade environments. As a driving force behind Laracore’s vision, he leads with precision and innovation—delivering robust, high-performance Laravel maintenance and development solutions that meet the highest global standards.